|
Tutorial
Configuration
Environment managment
Graph managment
Rules managment
Execution managment
|
Run Settings
In one parallel rewrite step, GPaR rewrite
the initial graph g into the graph g1 by replacing simultaneously all the matches by the right-hand sides of all the corresponding rules. To perform this rewrite process, click on the  , the Run Window appears: , the Run Window appears:
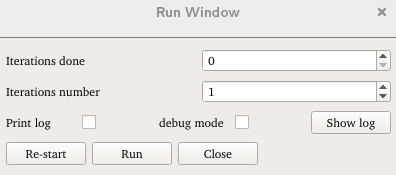 |
Run Window |
-
Iterations done indicates the number of iterations t 0 done or the initial iteration number for a restoring process.
- Iterations number indicates the number t of iterations which is required by the user.
- The check boxes Print log and debug mode enable to print the debug messages
in a log text file in order to detect why and where the process failed.
- The Show log button allows to see the log file on a text window.
- The Re-start button performs the computation from the initial graph g0 until gt.
- The Run button run the process from gt0 to gt.
To obtain g1, select the value 1 of the box titled iterations number and click on the run button. The box named Iterations done is incremented to 1 and the Progression Window appears. g1 is available graphically in this window.
If the value t greater than 1 is selected in the iterations number box, g1 will be rewritten into a new graph named g2, etc, until gt-1 is rewritten into gt.
The visualization window enables to see the graph evolution over the iterations.
Visualization Window
To see the graphs during the graph rewriting process, click on the  to make appear the result window: to make appear the result window:
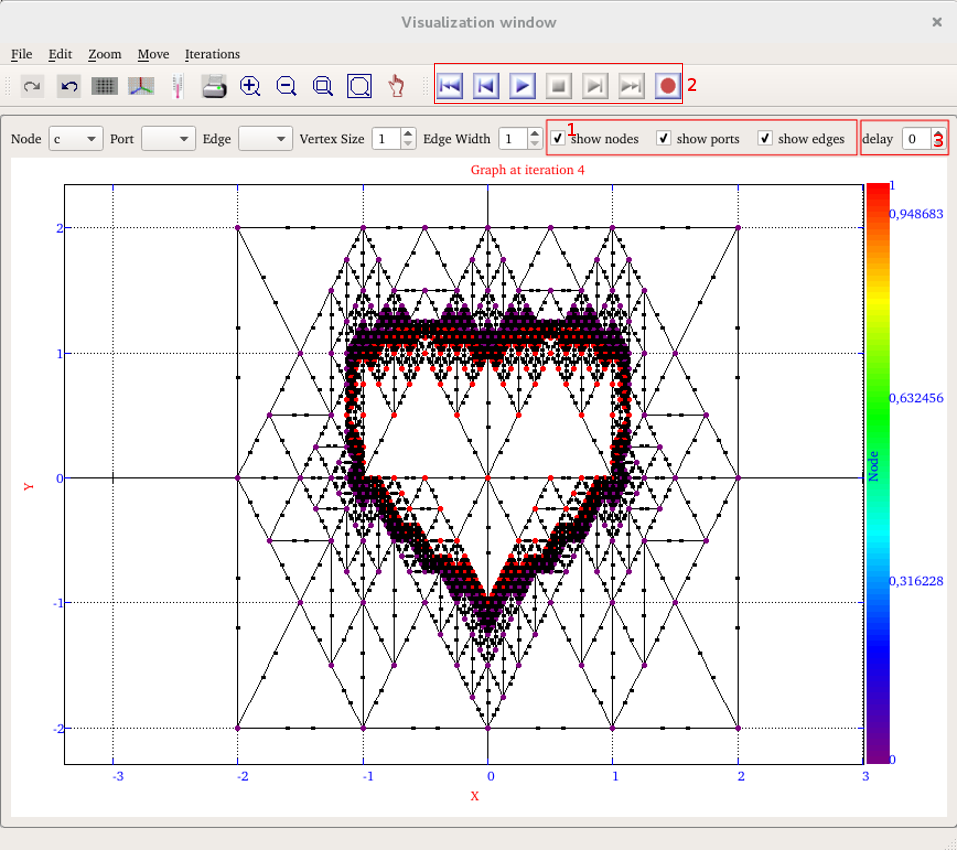 |
Visualization Window |
In the visualization window, it is possible to print the value of the state of nodes, ports or edges
by selecting the states to show from the bar 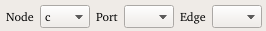 and to choose the width for vertices and edges representation as line or disk from the bar
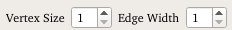 . .
In some cases, the number of items (ports, edges or nodes) can make the graphical representation unreadable. Moreover some items can be essential during the rewriting process but not relevant for the result visualization. That is why it is also possible to mask some items of the graph. In the area 1, unchecked the items you do not want to visualize.
To navigate into the iterations, use the movie panel in area 2.
 |
go back to the previous iteration |
 |
go back to the initial graph (iteration 0) |
 |
go to the next iteration |
 |
go to the last iteration |
 |
activate the automatic visualization mode. The delay between 2 iterations is defined in seconds in area 3. |
 |
stop the visualization mode |
 |
export all the graphs into image files in the project path |
|